

Document Actions
State and impacts
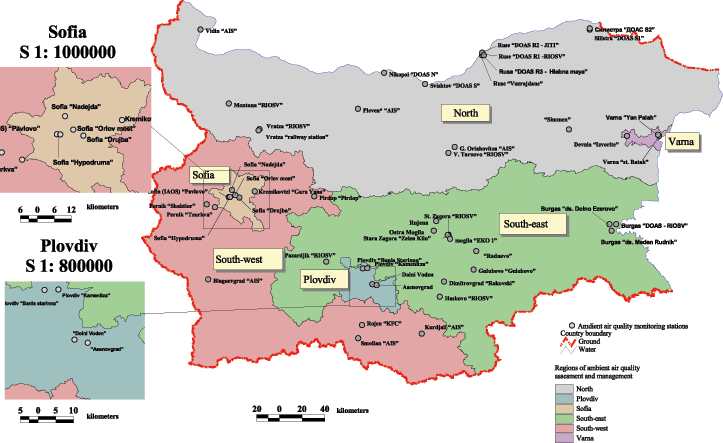
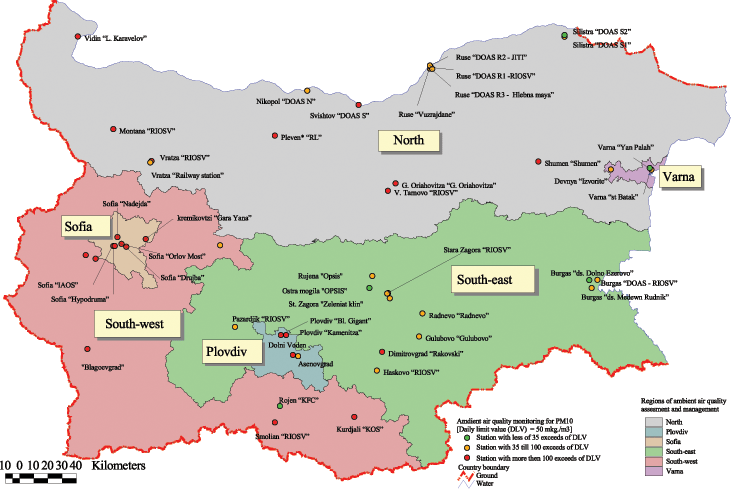
Under national and European legislation (Directive 96/62/ЕС) Bulgaria is divided into six air quality assessment and management areas (ROUKAVs).
Air quality data is compiled and analyses made for each area taking into account the specific nature of local communities.
Figure 1. Locations of air quality of Bulgaria, broken down by districts for assessment and management of air quality (RUKAV)
Sulphur dioxide
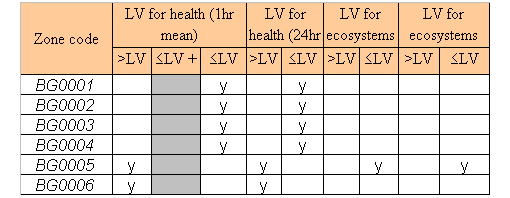
During the year, two ROUKAVs (the South-western and Southern/Thracian) registered exceedances of the mean hourly norm (MHN) and mean daily norm (MDN) for sulphur dioxide content in the air.
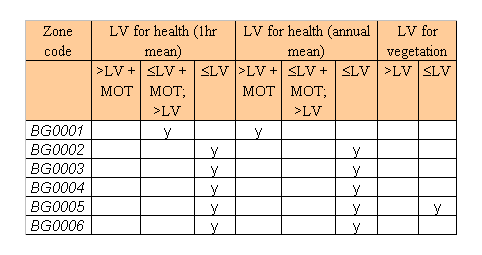
Figure 2. List of zones in relation to limit value exceedences for SO2
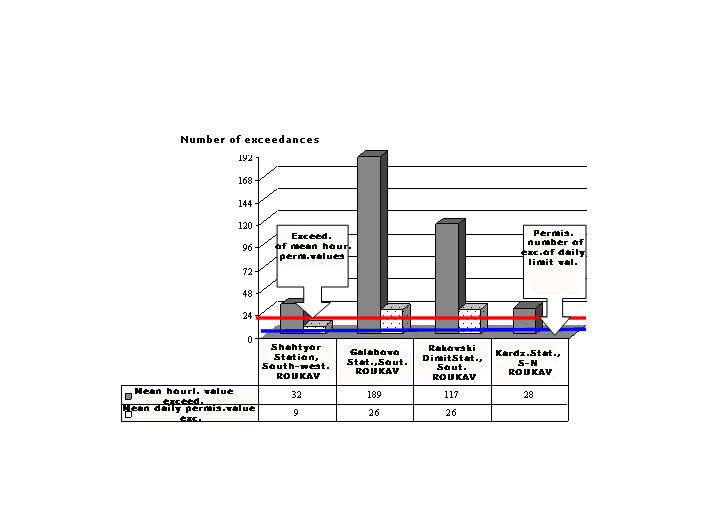
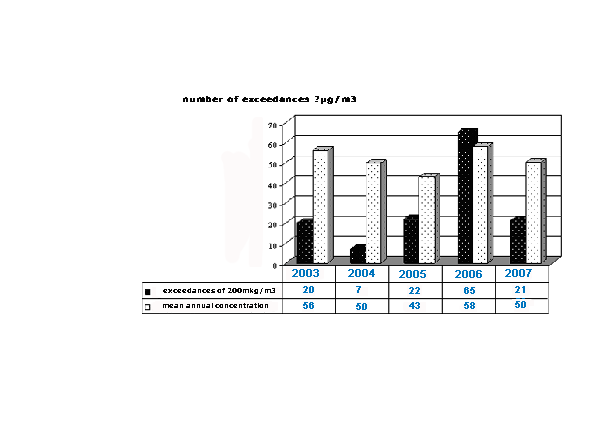
Figure 3. Incidence of exceedances of sulphur dioxide standards (hourly and daily)
Figure 4 Levels of sulphur dioxide pollution measured by ROUKAV
The main sources of sulphur dioxide emissions in the Southern ROUKAV were the three coal-fired power stations making up the Maritsa Iztok complex and also the Maritsa 3 coal-fired power station in Dimitrovgrad. Major sources in the South-western ROUKAV were the lead and zinc factory at Kardzhali and the Republika coal-fired power station. Emissions from fossil fuel burnt for home heating also contributed to the pollution.
Nitrous dioxide
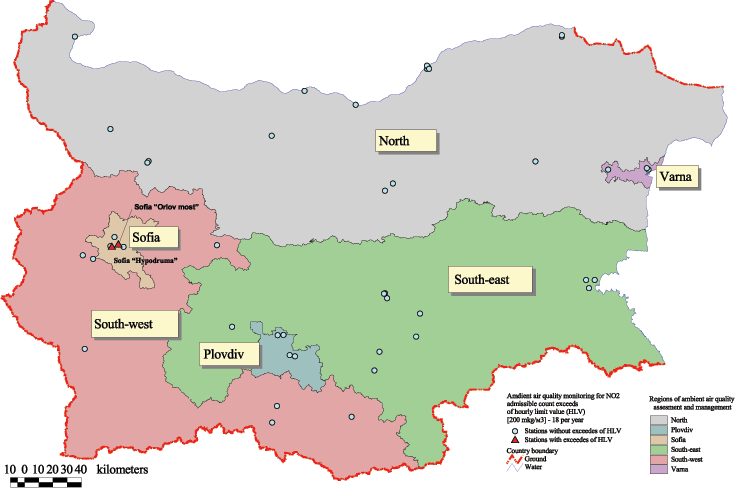
During the year, the only exceedance of nitrous dioxide MHN and MDN was registered by the Sofia ROUKAV, the main source being vehicle exhausts. Other ROUKAVs did not register exceedances in 2007: threshold breaches were within limit values or did not occur.
Figure 5. List of zones in relation to limit value exceedences for NO2/NOx
Figure 6. Breaches of nitrous oxide norms registered at the "Orlov Most" in Sofia from 2003-2007
Figure 7. Number exceedances srednochasovato rate of nitrogen dioxide in points in 2007
Fine dust particulates (PM10)
PM10 pollution continues to be a major air quality issue for all ROUKAVs. Each of the ROUKAVs registered MHN and MDN exceedances of PM10 during the year.
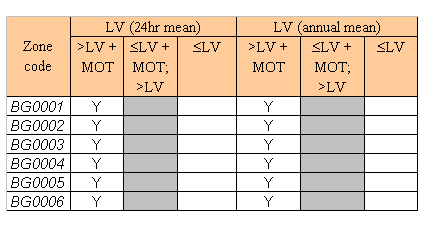
Figure 8. List of ROUKAVs registering limit value exceedances for PM10
Figure 9. Registered exceedances of PM10 mean daily norms
Figure 10. Number of exceedances of the daily average rate (ADN) of PM10 in points in 2007
The sources of excessive PM10 pollution were industry, households and transportation, and also polluted and badly-maintained road surfaces. A typical summer problem is the prolonged dry period, causing soil weathering, which in turn contributes to air pollution.
Ozone
Only the Southern/Thracian ROUKAV registered an exceedance of the ozone target of 120 μg/m3 (maximum eight-hour value within a day which must not be breached on more than 25 days in a year over a three-year period).
Figure 11. List of ROUKAVs where levels exceed or do not exceed target values or long-term objectives for ozone (2002/3/EC, Annex I)
Environmental impact
Sulphur, nitrogen, fine dust particulates and ozone are basic air quality factors. For this reason, the EU and EEA place particular emphasis on the proportion of Member State populations exposed to excessive levels of these pollutants. In this connection, 2007 air quality monitoring data were compared to the populations in each ROUKAV and nationwide to determine the proportion of people exposed to excessive pollutants. The results are shown below.
Percentage of people affected by SO2, NO2, PM10 and ozone pollution in each ROUKAV
| ROUKAV | SO2 | NO2 | PM10 | Ozone |
|---|---|---|---|---|
| BG0001 Metropolitan | 0 | 100 | 100 | 0 |
| BG0002 Plovdiv | 0 | 0 | 100 | 0 |
| BG0003 Varna | 0 | 0 | 100 | 0 |
| BG0004 Northern/Danubian | 0 | 0 | 36 | 0 |
| BG0005 Southwest | 15 | 0 | 27 | 0 |
| BG0006 Southern/Thracian | 12 | 0 | 52 | 14 |
| Nationwide | 5.4 | 16 | 55.4 | 3.6 |
Figures
Figure 1
Fullscreen image Original link

")
Figure 2
- Data source
- http://cdr.eionet.europa.eu/bg/eu/annualair/envsrm2sw/BG_Questionnaire_2008_EC_2004_461.xls
Fullscreen image Original link

Figure 3
Fullscreen image Original link
")
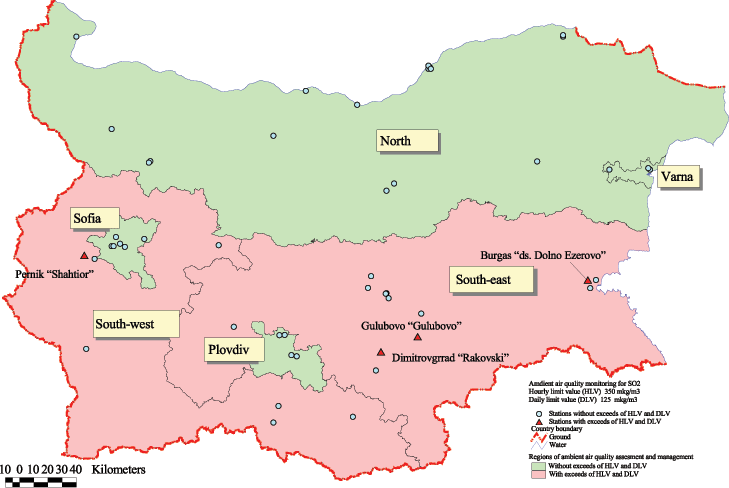

Figure 5
- Data source
- http://cdr.eionet.europa.eu/bg/eu/annualair/envsnpgdw/BG_Questionnaire_2007_EC_2004_461.xls
Fullscreen image Original link

Figure 6
Fullscreen image Original link

Figure 7
Fullscreen image Original link

Figure 8
- Data source
- http://cdr.eionet.europa.eu/bg/eu/annualair/envsnpgdw/BG_Questionnaire_2007_EC_2004_461.xls
Fullscreen image Original link

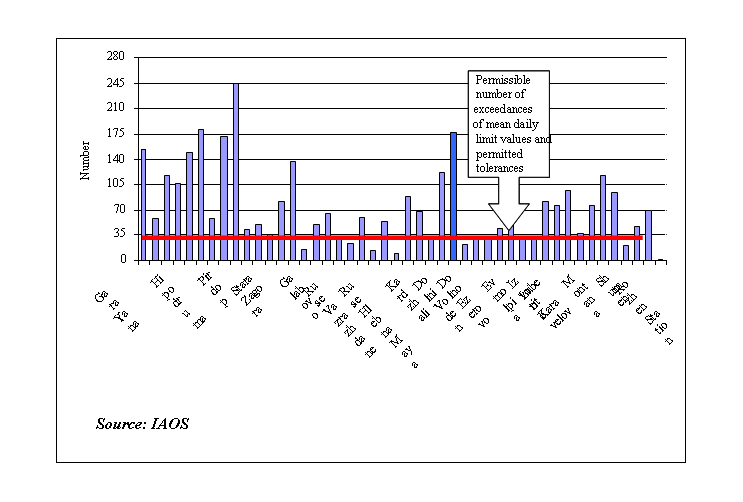

Figure 10
Fullscreen image Original link
 of PM10 in points in 2007")
- Links to related indicators (CSI - Core Set of Indicators)

