

Document Actions
Drivers and pressures
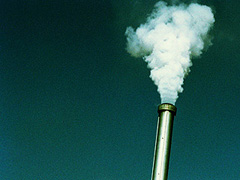
Harmful substance emissions
Oxidant emissions
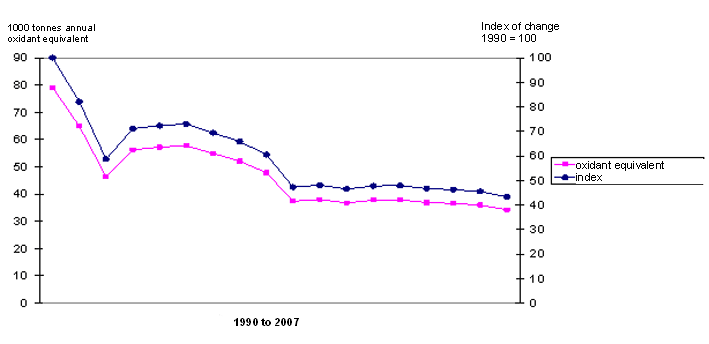
Figure 12. Oxidant emissions in oxide equivalent and index of change, Bulgaria.
During the period 1990-2006, harmful substance emissions expressed in oxide equivalent fell from 79.1 ktonnes to 36 ktonnes − a reduction of some 55 %.
Ozone precursor emissions
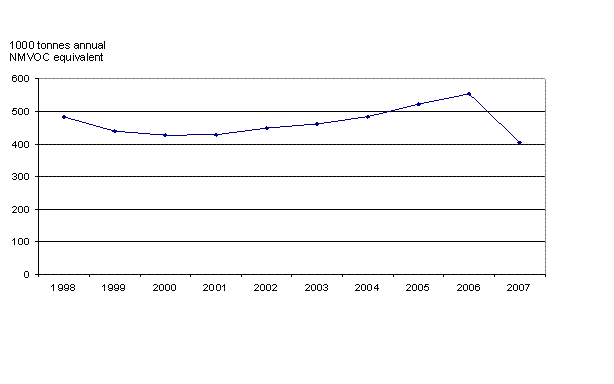
Figure 13. Changes in ozone precursor emissions shown as NMVOC equivalent between 1998 and 2007.
After a rise in ozone precursor emissions between 2001 and 2006, there was a significant drop in 2007.
This sharp fall in emissions was largely due to the implementation of a uniform methodology for creating an inventory of harmful substances in the air, as set out in the Convention on Long-Range Transboundary Air Pollution and the United Nations Framework Convention on Climate Change. The new methodology was approved in Order No. RD 40/22.01.2008 issued by the Ministry of the Environment and Waters. The new emission factors are in line with the EMEP/CORINAIR Emission Inventory Guidebook.
After any change in emission monitoring methodologies the EU obliges Member States to recalculate and resubmit data on harmful emissions from their benchmark years to the reporting year. To this effect, a public tendering procedure was set in motion in 2009 to recalculate harmful substance emissions into the air for the period 1980-2008 in relation to the new methodology. Recalculated data will be reported under relevant national obligations during 2011.
PM10 precursor emissions
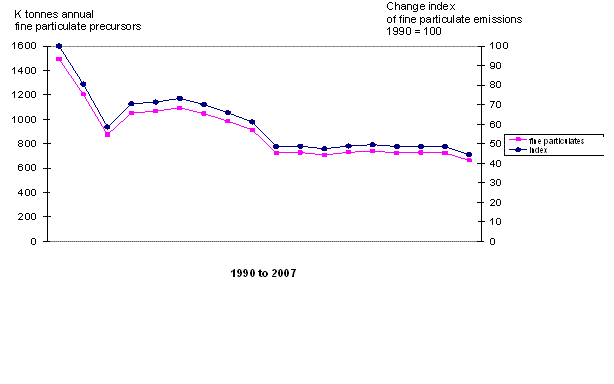
Figure 14. PM10 precursor emissions and change index, Bulgaria.
PM10 precursor emissions have fallen from 1 494 ktonnes in 1990 to 725 ktonnes in 2006, a reduction of approximately 52 %. The overall reduction relates to all three precursors.
Figures
Figure 12
Fullscreen image Original link


Figure 13
Fullscreen image Original link


- Links to related indicators (CSI - Core Set of Indicators)

