

Document Actions
State and impacts

INVENTORISING GREENHOUSE GAS EMISSIONS IN BULGARIA
As a party to the United Nations' Framework Convention on Climate Change (the UNFCCC), Bulgaria is compiling annual inventories of greenhouse gas (GHG) emissions by sources and sinks, using the methodology set out in the convention.
National inventories have been compiled since 1988, Bulgaria's benchmark year. To date, 18 GHG inventories have been completed and handed over to the UNFCCC Secretariat, the last for 2007.
The 2007 GHG inventory shows that overall GHG emissions in CO2 equivalent came to 75,793 gigagrammes (Gg) without taking land use, changes in land use and forestry (LULUCF) sector sinks into account. Net emissions, taking account LULUCF sinks, were 68,991 Gg.
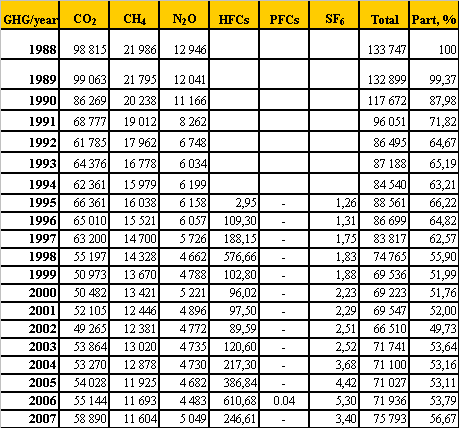
The table below shows a summary of emissions of major GHGs, without taking LULUCF into account, and a comparison of overall emissions with the benchmark year of 1988.
Figure 1. Aggregate GHG emissions (excluding LULUCF), Gg CO2 equivalent and percentage of overall annual emissions compared with 1988, the benchmark year.
In 2007, CO2 emissions, expressed as CО2 equivalent, had the greatest share of overall GHG emissions at 77.7 %, followed by methane (CH4) emissions at 15.3 % and nitrous oxide (N2O) emissions at 6.7 %; polycyclic aromatic hydrocarbons (F) gases had a 0.3 % share.
OVERALL GHG EMISSIONS BY SECTOR BETWEEN 1988 AND 2007
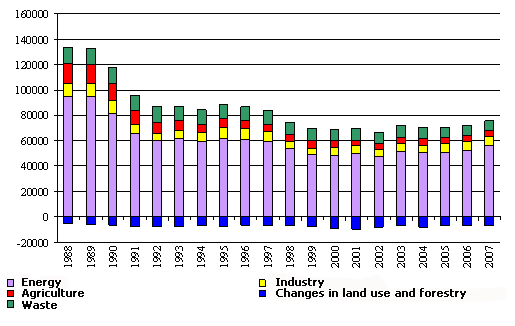
Figure 2 shows overall GHG emissions from all sectors between 1988 and 2007 in Gg СО2 equivalent. СО2 absorbed by forests is taken into account.
Figure 2. Overall greenhouse gas emissions by sector between 1988 and 2007, Gg CO2 equivalent.
Figures
Figure 1
Data source
.
Fullscreen image Original link
, Gg CO2 equivalent and percentage of overall annual emissions compared with 1988, the benchmark year")
Figure 2
Data source
.
Fullscreen image Original link


