

Document Actions
Drivers and pressures

The Energy sector
In accordance with the nomenclature of the Intergovernmental Panel on Climate Change (the IPCC), emissions from fuel burning for energy generation are included under the energy sector. The sector also includes random emissions from the production, transport and distribution of solid, liquid and gaseous fuels.
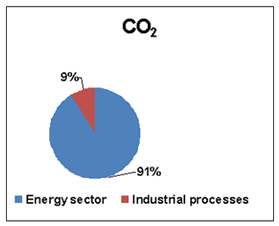
The energy sector occupies a key place in the Bulgarian economy. It was the source of more than 74 % of aggregate GHG emissions in 2007. CO2 contributes the greatest share of aggregate GHG emissions in the sector, at up to 91 %.
Combustion for energy generation occupies the greatest share of GHG emissions at more than 45 % of the sector's total. This is the sole subsector in which there was a significant increase on the benchmark year of 1988: from 48 % to 59 % in 2007. In other subsectors this share changes as follows: combustion in industrial processing from 27 % to 19 %; transport from 15 % to 14.6 % public buildings and households from 9.8 % to 2.9 %. Reduced direct burning of fuels in households not only cut GHG emissions but also air pollution.
Emission increases in 2007 on prior years were only apparent in industrial processing.
The overall national fuel and energy balance
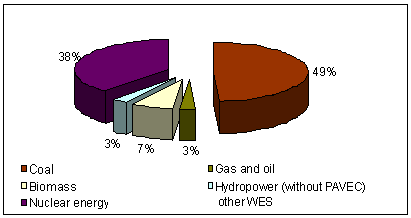
Primary energy generation in 2007 came to 9,738 ktoe[1] according to the National Statistical Institute's (NSI) Energy Balances 2007, and was some 5 % less than in 2000. Between 2000 and 2007 the greatest amount of primary energy was generated (PEG) in 2002 largely from nuclear plants. A significant increase in natural gas production is apparent since 2004, due to development of the Galata gas field. Use of renewable energy sources (RES), mainly hydropower and biomass, has grown from 788 ktoe in 2000 to 1029 ktoe in 2007.
Figure 3. The structure of primary energy generation in 2007.
Bulgaria has limited resources of coal, crude oil and natural gas: coal is a major factor in national energy sufficiency, with a PEG share of 43.96 % in 2000 and 49 % in 2007.
In 2007, Bulgaria imported 14,952 ktoe worth of energy commodities, or some 23 % more than in 2000. Since 2003, fuel imports have grown steadily, crude oil and its derivatives being the major contributors to this.
Fuel and energy exports almost doubled since 2000 due to growing petroleum product and electric power exports.
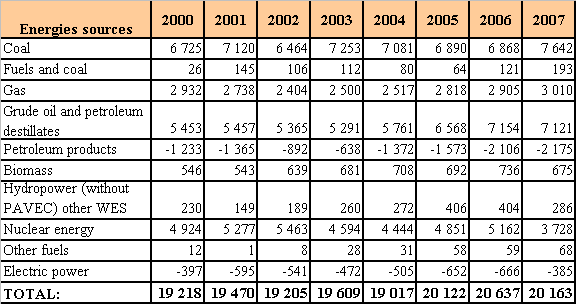
Gross domestic consumption
Coal and nuclear fuel led domestic consumption between 2000 and 2007. After a drop from 2003 onwards, in 2007 coal use grew by 10 % on 2006. In 2007, nuclear fuel, mainly for power generation, had the lowest cost over the review period, due to the closure of Units 3 and 4 at the AETs Kozloduy nuclear power station. The closure also resulted in a 73 % drop in 2007 net power exports on 2006.
The slow growth in natural gas consumption, by an annual average of 0.7 % between 2000 and 2007, is a positive trend.
Bulgaria's major RESs are biomass and hydropower. Negligible amounts of wind, geothermal, solar energy and biofuels have also been used in recent years. The share of RES in 2007 in gross domestic consumption comes to 5.1 %: down from 5.8 % in 2006.
Figure 4. Gross domestic consumption of fuels and energy by source, 2000-2007, ktoe.
Ultimate energy consumption
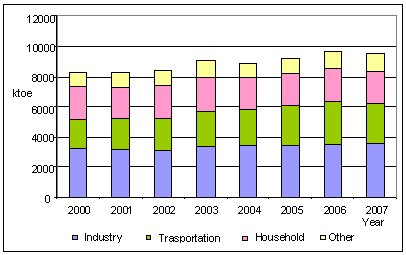
Ultimate energy consumption had grown in 2007 by 13.1 % on 2000, the sole drop being in household consumption which fell by 5.6 %.
Ultimate energy consumption dropped in 2007 on 2006 across all sectors except industry, where it grew by 2.2 %. Households showed the greatest drop, -5.3 % while transport registered its first ever drop, -4.4 %. The Miscellaneous category also fell, by -3.6 %.
Industry had the greatest share of ultimate energy consumption at 37.9 %, followed by transport at 28.1 %, households at 21.8 % and miscellaneous at 12.2 %. Figure 4 shows ultimate energy consumption by economic sector.
Figure 5. Ultimate energy consumption by economic sector, 2000 to 2007, ktoe.
The greatest structural changes in ultimate energy consumption between 2000 and 2007 were the drop in the share of coal based fuels, from 6.6 % in 2000 to 3.1 % in 2007, and the rise of the share of petroleum products from 36.3 % to 38.9 %. In 2007 natural gas in ultimate energy consumption by fuel and energy commodity reached its 2000 level. Electric power use dropped insignificantly, while thermal power had dropped by almost 2 %.
Energy intensiveness
Between 2001 and 2006, energy intensity – gross energy consumption per unit of gross domestic product – declined. Figure 5 shows energy intensity as the amount of kilotonnes of oil equivalent (ktoe) needed to create a thousand leva-worth of Bulgarian gross domestic product.
Table 1. Energy intensiveness between 2001 and 2007
(Source: http://www.nsi.bg/ORPDOCS/Energy-4.OEB.xls):
| 2001 | 2002 | 2003 | 2004 | 2005 | 2006 | 2007 | |
|---|---|---|---|---|---|---|---|
| GDPE/GDP: ktoe per BGN1000 of GDP (2001 = 100) | 0.655 | 0.612 | 0.595 | 0.541 | 0.539 | 0.524 | 0.479 |
The trend of the economy's energy intensity is positive, indicating a decoupling of energy use from economic growth, and thus showing that Bulgarian economic development is sustainable.
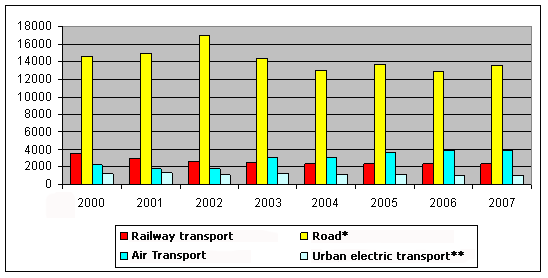
Passenger transport
Lack of data on private car journeys limits assessment of overall passenger transport demand on public transport. The analyses which follow show passenger transport productivity as the product of the
number of passengers and the number of kilometres over which they were carried: passenger kilometres (pkm): an indicator used across Europe.
Figure 6 shows pkm between 2000 and 2007 by transport type – rail, road, air and electric urban transport – with a drop in passenger transportation for all types except air. This is clearly due to the rise in private car use that has mainly impacted road transport.
Figure 6. Passenger transport productivity by transport type, million pkm, excluding private car use.
(* includes paid urban, rural and international transportation
** includes tram, trolleybus and metro rides)
Industrial processes
GHG emissions from the industrial processes originate from manufacturing and material use. Combustion does not form these emissions, which include all major GHGs and GHG precursors.
CO2 contributed the greatest share of GHG emissions from the industrial processing in 2007 at 77 %. Second comes N2O with 19 % and third is CH4 with 1 % of overall emissions expressed in CO2 equivalent. The sector's most significant GHG sources are cement manufacture (CO2), steelmaking (CO2), lime making (CO2) and nitrous oxide manufacture (N2O).
Solvent use
GHG emissions from solvent use result from the manufacture or application of paint and glue, the use of solvents in light industry and the home, dry cleaning, vegetable oil manufacture and medicine and anaesthetic manufacture. The sector mainly emits non-methane volatile organic compounds (NMVOCs) and N2O.
NMVOC emissions are 8.03 Gg, or 10 % of Bulgarian NMVOC emissions.
Agriculture
GHG emissions from the agriculture result from the manufacture and processing of agricultural produce, soil fertilisation and animal waste processing. The sector mainly emits CH4 and N2O.
Farm animal enteric fermentation is the greatest source of CH4 emissions in the sector at 65.31 Gg per year. These are also significant N2O emissions, mainly from farmland, their share in 2007 being 88 % of agricultural emissions.
A certain amount of GHG precursors, carbon monoxide and nitrogen oxides, are emitted during stubble burning.
Land use, land use change and forestry
LULUCF encompasses processes of CO2 exchange between biomass sources – forest, grassland, other plantations and soils – and the atmosphere. The exchange of CO2 streams from and to the atmosphere is a compound process also affected by human action. Thus, CO2 absorption from forests is linked with the husbandry and management of timber plantations for industrial felling. Wasteland afforestation to stop erosion also leads to CO2 accumulation in biomass.
Atmospheric emissions of CO2 result from forest clearance and burning to create farmland, and from changes in the organic composition of soils from erosion or chemical treatment.
LULUCF includes actions which also affect CO2 streams to and from the atmosphere: soil drainage, changes in plants' cultivation periods – mainly in tropical regions – and sequencing longer and shorter cultivation periods, flooding and groundwater changes due to human intervention, inter alia.
As in prior years, the 2007 the GHG inventory defines net CO2 absorption from the changes in forestry and other biomass sources.
CO2 absorption is taken as the net balance between carbon absorbed from the atmosphere and the amount of biomass (trees) cut for use in heating, papermaking and other biomass-intensive fields.
Waste
GHG emissions from the waste result from hard household and public waste collection, storage and treatment and also from household and industrial wastewater treatment.
Hard waste may be treated by deposition at tips, recycling or burning whether to destroy it or to derive energy. Only land-filled/deposition hard waste GHG emissions are taken into account.
Deposited hard waste emits СН4 as a result of anaerobic and aerobic organic dissolution. CH4 emissions lead the 2007 waste inventory in Bulgaria.
Wastewater treatment is the second great source of СН4 in this sector, with industrial, household and public wastewater assessed separately.
Figure 7. Shares of major GHG emission sources in 2007, % - (CO2).
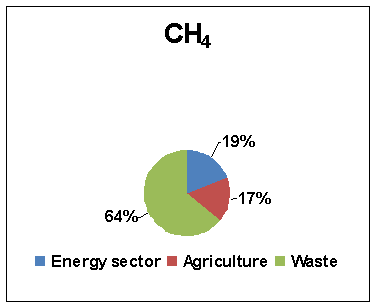
Figure 8. Shares of major GHG emission sources in 2007, % - (CH4).
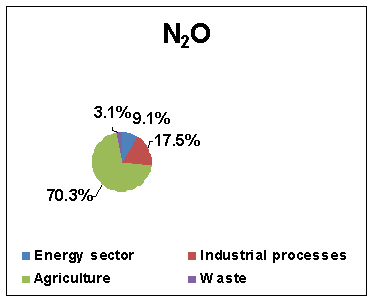
Figure 9. Shares of major GHG emission sources in 2007, % - (NO2).
A basic international assessment indicator of greenhouse gas emissions is the amount of GHG emitted per capita.
Figure 10. Per person annual GHG emissions, tonnes of CO2 equivalent.
The trend in the change in overall GHG emissions is repeated assessing per person annual emissions. Bulgaria's overall per person GHG emissions in CO2 equivalent between 1988 and 2002 dropped from 14.9 tonnes in 1988 to 8.5 tonnes in 2002, thereafter rising to 9.2 tonnes in 2003 and 9.9 tonnes in 2007.
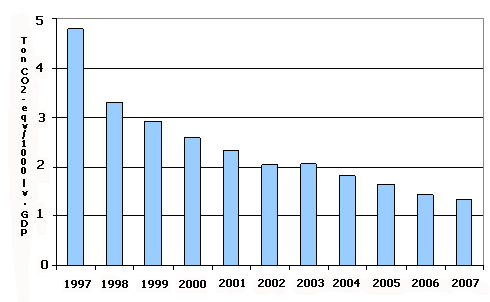
GHG emissions are closely associated with economic growth, since energy and natural resource use grow as business becomes more buoyant. The reduction of this correlation is a sign of sustainable development; hence, annual GHG emissions per unit of gross domestic product are an interesting indicator. Figure 9 shows the development of this indicator in Bulgaria between 1997 and 2007.
Figure 11. Annual GHG emissions per unit of gross domestic product, tonnes of СО2 equivalent per 1000 leva product.
Over a decade, GHG emissions resulting from the creation of 1000 leva worth of gross domestic product have fallen significantly from 4.8 tonnes of СО2 equivalent in 2000 to 1.3 tonnes of СО2 equivalent in 2007.
Figures
Figure 3
- Data source
- http://www.nsi.bg/ORPDOCS/Energy-4.OEB.xls
Fullscreen image Original link


Figure 4
- Data source
- http://www.nsi.bg/ORPDOCS/Energy-4.OEB.xls
Fullscreen image Original link

Figure 5
- Data source
- http://www.nsi.bg/ORPDOCS/Energy-4.OEB.xls
Fullscreen image Original link

Figure 6
- Data source
- http://www.nsi.bg/otrasal.php?otr=6
Fullscreen image Original link

Figure 7
- Data source
- http://www.nsi.bg/ORPDOCS/Ecology_1.1.xls
Fullscreen image Original link
")
Figure 8
- Data source
- http://www.nsi.bg/ORPDOCS/Ecology_1.1.xls
Fullscreen image Original link
")
Figure 9
- Data source
- http://www.nsi.bg/ORPDOCS/Ecology_1.1.xls
Fullscreen image Original link
")
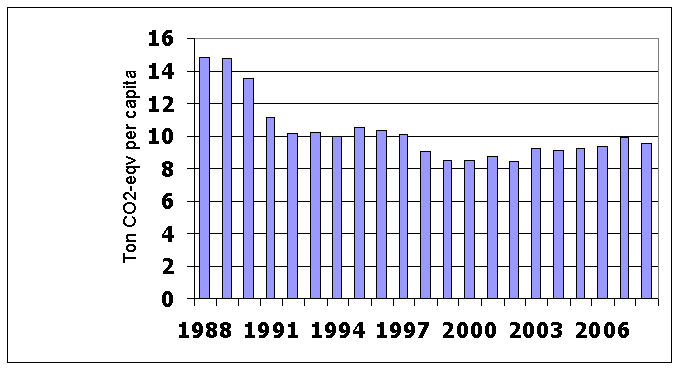

Figure 11
Fullscreen image Original link


