

Document Actions
Drivers and pressures

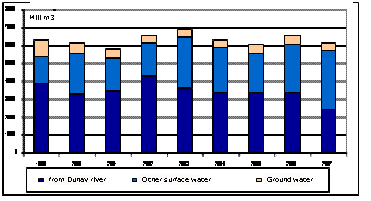
Figure 11. Total gross freshwater water abstraction from water sources, million m3.
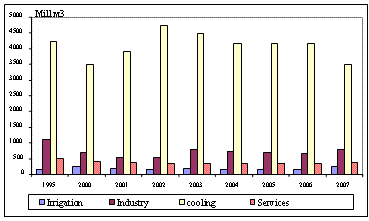
Figure 12. Water used, million m3.
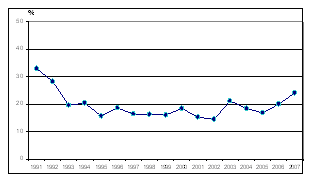
Figure 13. Total gross fresh water abstraction, WEI (excluding the waters of the Danube).
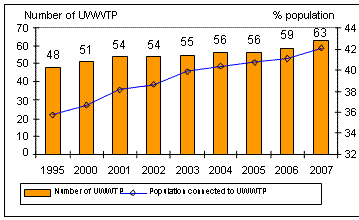
Figure 14. Active UWWTP and population connected.
In 2007, freshwater abstraction was 6.2 billion.m3, which is close to the average volume for the last eight years (6.3 billion m3). The highest level was registered in 2003 (7.3 billion m 3) and the lowest was in 2005 (6.0 billion.m3). Fluctuations in water volume is determined mainly by water power station. Groundwater constitutes 8 % of total water abstraction and this water abstraction is mainly for drinking purposes. In 2007, underground sources were 473 million m3, which constitute 82 % of those in 2000. One of the main reasons for the decline in water abstraction is the increase in the costs of abstraction and delivery service. Approximately 67 % of fresh water in 2007 were abstracted by own supply business unit and the remainder is divided between providers - public water supply (water companies) and irrigation systems.
The pressure on water is assessed by the ratio: freshwater abstraction/available freshwater resources. Warning threshold is set around 20%, while consumption of more than 40 % indicates an unsustainable water use. Abstraction in the country after 1992 fall into the frameworks of sustainable development.
Figures
Figure 11
- Data source
- http://www.nsi.bg/ORPDOCS/Ecology_9.1.xls
Fullscreen image Original link


Figure 12
- Data source
- http://www.nsi.bg/ORPDOCS/Ecology_9.3.xls
Fullscreen image Original link

Figure 13
- Data source
- http://www.nsi.bg/ORPDOCS/Ecology_9.8.xls
Fullscreen image Original link
")
Figure 14
- Data source
- http://www.nsi.bg/ORPDOCS/Ecology_9.7.xls
Fullscreen image Original link


