

Document Actions
State and impacts
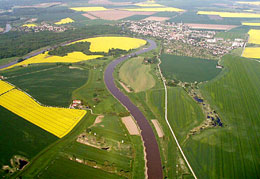
Figure 1. Area distribution by classes of land cover
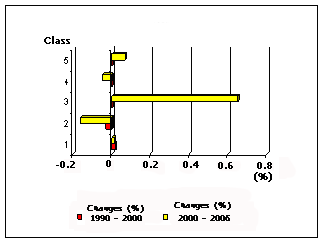
Figure 2. Changes in land cover. Level I as defined in CORINE Land Cover
Bulgaria's farmlands cover some 51.2 % of the country's area, compared to 42.67 % for forests and 4.9 % for urban areas. From 1990-2006 the structure of land use by class remained relatively unchanged, although there was a strong trend towards urban expansion in certain localities: e.g. tourism in coastal and high mountain areas and mining in areas rich in underground resources. To date, transport infrastructure development has had greater impact on biodiversity than on the soil (http://eea.government.bg/eng).
The state of the soil is assessed under the National Soils Monitoring Programme on the basis of a 16 х 16 km network comprising 407 points and the monitoring of a set of indicators: presence of heavy metals, stable organic polluters, carbon, nitrogen and phosphorus.
Monitoring during the period 2004-2007 led to the conclusion that Bulgaria's soils are ecologically sound, both with regard to nutrient components, organic matter reserves,[1] heavy metal and metalloid pollution. Median values are above the accepted mean reserve values[2] and below maximum concentrations. Breaches of maximum concentrations (MAC)[3] have occurred at only 4 % of the network points. There are no MAC breaches in relation to mercury and no stable organic pollutants have been registered. Between 2004 and 2007, measured content was several times lower than MAC (over 80 % of measured values are below the discovery threshold for the method).
Major sources of local soil pollution are: industrial processes, mining, waste storage, incidental spillages and stores of absolute pesticides. To date there has been insufficient study of local soil pollution, compared with diffused pollution. There are 1 438 registered areas of possible pollution at the preliminary review stage.
Soil erosion is the basic process caused by both natural and climate factors and human activity: incorrect treatment, overgrazing, deforestation, fires, etc. In recent years, the monitoring of erosion processes has seen a slight trend towards reduction, both as regards area affected and mean annual soil loss. Around 2.11 % of Bulgaria's total surface area is at very great risk of water erosion,[4] at average intensities of 10-15 t/ha/y. A high erosion risk exists for 4.59 % of the country's land (average intensities of 5-10 t/ha/y). The mean annual erosion intensity varies, depending on the type of land use, from 8 t/y (perennial plants) to 48 t/y (crops). In recent years, wind weathering has also affected a relatively constant area (3 818 980 ha in 2007)[5] and caused soil erosion of around 300 t/ha/y.
The proportion of acidic soils is approximately 1.5 million hectares, or 11 % of farmland. Around 500 000 hectares of this has acidity levels which are toxic to most farm crops.
The total area of salinated soils is assessed as 33 310.027 hectares. Depending on the contents and type of water-soluble salts, salinated soils are typically classified as solonez, solonchak and solonez-solonchak (14 186.047 hectares). Mildly salinated soils or soils salinated in profile depth (solonchak and solonez) are more common, amounting to some 19 123.98 hectares.
[1] Reserves – biogenic element content
[2] Mean reserves – optimum content
[3] Maximum permissible concentrations of soil pollutants relate to the content of harmful substances in soils which, when exceeded in a given type of land use, entail risks to the environment and human health (Order No 3, Darzhaven Vestnik Official Gazette, Issue 71 of 2008
[4] USLE assessment
[5] WEQ assessment
Figures
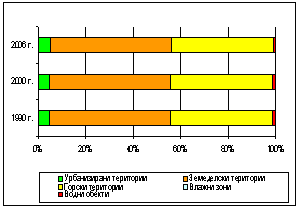


Figure 2
Fullscreen image Original link


